


- Bài 1: Giới thiệu Matplotlib
- Bài 2: Môi trường cài đặt
- Bài 3: Jupyter Notebook
- Bài 4: Pyplot API
- Bài 5: Khái niệm cơ bản về Plot
- Bài 6: PyLab
- Bài 7: Giao diện hướng đối tượng
- Bài 8: Figture và Axes
- Bài 9: Multiplots
- Bài 10: Hàm Subplots() và Subplot2grid()
- Bài 11: Grids
- Bài 12: Định dạng Axes
- Bài 13: Đặt giới hạn X và Y
- Bài 14: Trục đôi
- Bài 15: Bar Plot
- Bài 16: Histogram
- Bài 17: Pie Chart ( Biểu đồ tròn )
- Bài 18: Scatter Plot ( Biểu đồ phân tán )
- Bài 19: Contour Plot ( Đồ thị đường bao )
- Bài 20: Quiver Plot
- Bài 21: Box Plot ( Biểu đồ nén)
- Bài 22: Violin Plot
- Bài 23: Three-dimensional Plotting ( Biểu đồ 3 chiều )
- Bài 24: 3D Contour Plot ( Biểu đồ viền 3D )
- Bài 25: 3D Wireframe plot
- Bài 26: 3D Surface plot
- Bài 27: Làm việc với văn bản
- Bài 28: Biểu thức toán học
- Bài 29: Làm việc với ảnh
- Bài 30: Transforms ( Biến đổi trục )
Bài 21: Box Plot ( Biểu đồ nén) - Matplotib Cơ Bản
Đăng bởi: Admin | Lượt xem: 7769 | Chuyên mục: AI
1. khái niệm cơ bản :
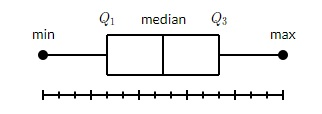
Biểu đồ nén hiển thị tóm tắt tập hợp dữ liệu có chứa minimum, phần tư thứ nhất, trung vị, phần tư thứ ba và maximum. Một đường thẳng đứng đi qua hộp ở trung tuyến. Râu đi từ mỗi phần tư đến nhỏ nhất hoặc tối đa.
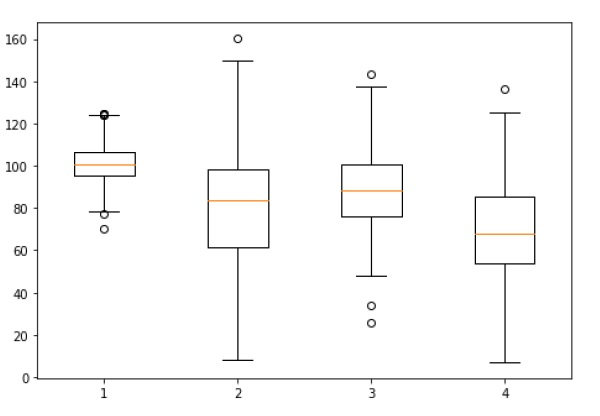
Ta tiến hành tạo biểu đồ box. Ta sử dụng hàm numpy.random.normal () để tạo dữ liệu giả. Nó cần ba đối số, giá trị trung bình , độ lệch chuẩn của phân phối chuẩn và số lượng giá trị mong muốn.
np.random.seed(10)
collectn_1 = np.random.normal(100, 10, 200)
collectn_2 = np.random.normal(80, 30, 200)
collectn_3 = np.random.normal(90, 20, 200)
collectn_4 = np.random.normal(70, 25, 200)
Danh sách các mảng mà ta đã tạo ở trên là đầu vào bắt buộc duy nhất để tạo boxplot. Sử dụng đoạn code data_to_plot :
fig = plt.figure()
# Create an axes instance
ax = fig.add_axes([0,0,1,1])
# Create the boxplot
bp = ax.boxplot(data_to_plot)
plt.show()
Kết quả như sau :
2. Ví dụ :
Các ví dụ cơ bản về biểu đồ nén :
import numpy as np
import matplotlib.pyplot as plt

# Fixing random state for reproducibility
np.random.seed(19680801)

# fake up some data
spread = np.random.rand(50) * 100
center = np.ones(25) * 50
flier_high = np.random.rand(10) * 100 + 100
flier_low = np.random.rand(10) * -100
data = np.concatenate((spread, center, flier_high, flier_low))
fig1, ax1 = plt.subplots()
ax1.set_title('Basic Plot')
ax1.boxplot(data)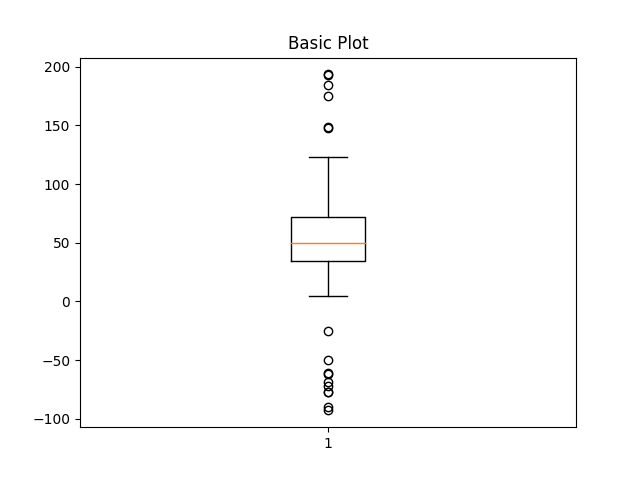
Kết quả :
{'whiskers': [<matplotlib.lines.Line2D object at 0x7fb114c3df60>, <matplotlib.lines.Line2D object at 0x7fb114c3d048>], 'caps': [<matplotlib.lines.Line2D object at 0x7fb114c3d8d0>, <matplotlib.lines.Line2D object at 0x7fb114c13390>], 'boxes': [<matplotlib.lines.Line2D object at 0x7fb114c3dcc0>], 'medians': [<matplotlib.lines.Line2D object at 0x7fb1146f4518>], 'fliers': [<matplotlib.lines.Line2D object at 0x7fb1146f42e8>], 'means': []}fig2, ax2 = plt.subplots()
ax2.set_title('Notched boxes')
ax2.boxplot(data, notch=True)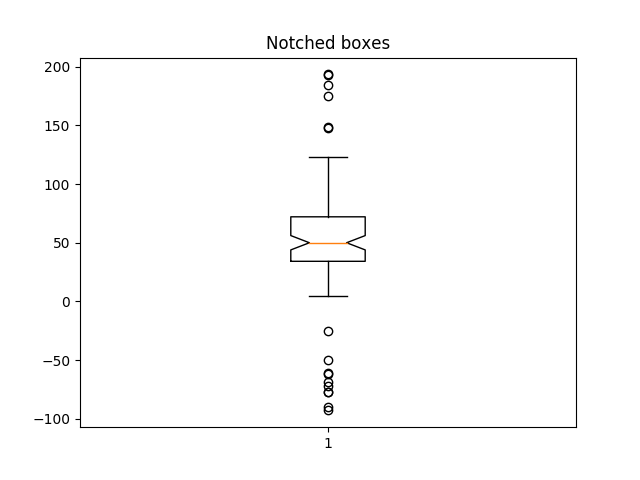
Kết quả :
{'whiskers': [<matplotlib.lines.Line2D object at 0x7fb113e887f0>, <matplotlib.lines.Line2D object at 0x7fb113e88ba8>], 'caps': [<matplotlib.lines.Line2D object at 0x7fb113e88ef0>, <matplotlib.lines.Line2D object at 0x7fb113e7e278>], 'boxes': [<matplotlib.lines.Line2D object at 0x7fb113e886a0>], 'medians': [<matplotlib.lines.Line2D object at 0x7fb113e7e5c0>], 'fliers': [<matplotlib.lines.Line2D object at 0x7fb113e7e908>], 'means': []}green_diamond = dict(markerfacecolor='g', marker='D')
fig3, ax3 = plt.subplots()
ax3.set_title('Changed Outlier Symbols')
ax3.boxplot(data, flierprops=green_diamond)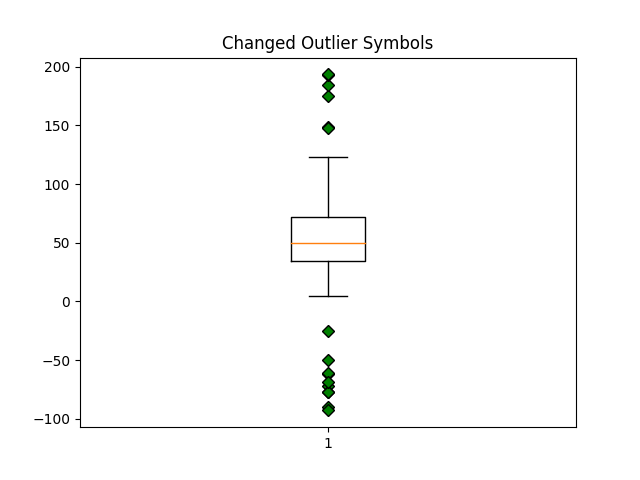
Kết quả :
{'whiskers': [<matplotlib.lines.Line2D object at 0x7fb113c908d0>, <matplotlib.lines.Line2D object at 0x7fb113c90c88>], 'caps': [<matplotlib.lines.Line2D object at 0x7fb113c90fd0>, <matplotlib.lines.Line2D object at 0x7fb113db1358>], 'boxes': [<matplotlib.lines.Line2D object at 0x7fb113c90780>], 'medians': [<matplotlib.lines.Line2D object at 0x7fb113db16a0>], 'fliers': [<matplotlib.lines.Line2D object at 0x7fb113db19e8>], 'means': []}fig4, ax4 = plt.subplots()
ax4.set_title('Hide Outlier Points')
ax4.boxplot(data, showfliers=False)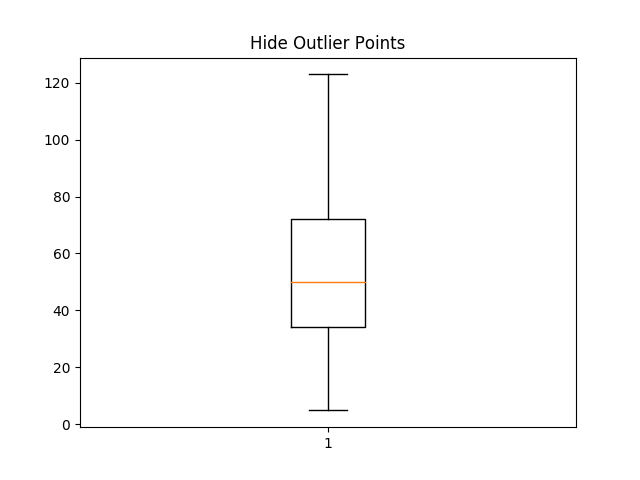
Kết quả :
{'whiskers': [<matplotlib.lines.Line2D object at 0x7fb113b87518>, <matplotlib.lines.Line2D object at 0x7fb113b878d0>], 'caps': [<matplotlib.lines.Line2D object at 0x7fb113b87c18>, <matplotlib.lines.Line2D object at 0x7fb113b87f60>], 'boxes': [<matplotlib.lines.Line2D object at 0x7fb113b873c8>], 'medians': [<matplotlib.lines.Line2D object at 0x7fb113b61160>], 'fliers': [], 'means': []}red_square = dict(markerfacecolor='r', marker='s')
fig5, ax5 = plt.subplots()
ax5.set_title('Horizontal Boxes')
ax5.boxplot(data, vert=False, flierprops=red_square)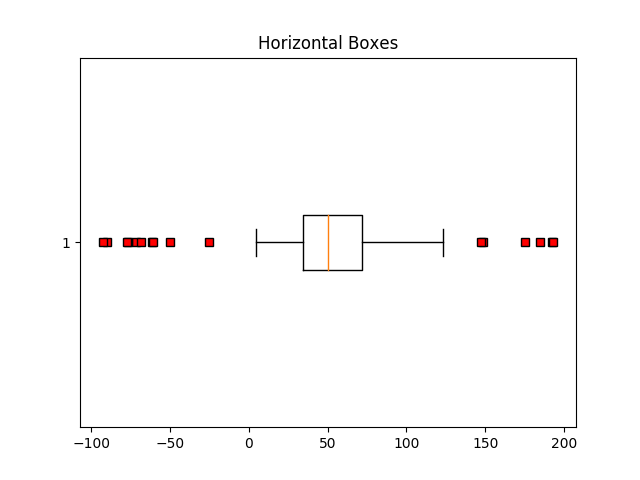
Kết quả :
{'whiskers': [<matplotlib.lines.Line2D object at 0x7fb113d842e8>, <matplotlib.lines.Line2D object at 0x7fb113d846a0>], 'caps': [<matplotlib.lines.Line2D object at 0x7fb113d849e8>, <matplotlib.lines.Line2D object at 0x7fb113d84d30>], 'boxes': [<matplotlib.lines.Line2D object at 0x7fb113d84198>], 'medians': [<matplotlib.lines.Line2D object at 0x7fb113d680b8>], 'fliers': [<matplotlib.lines.Line2D object at 0x7fb113d68400>], 'means': []}fig6, ax6 = plt.subplots()
ax6.set_title('Shorter Whisker Length')
ax6.boxplot(data, flierprops=red_square, vert=False, whis=0.75)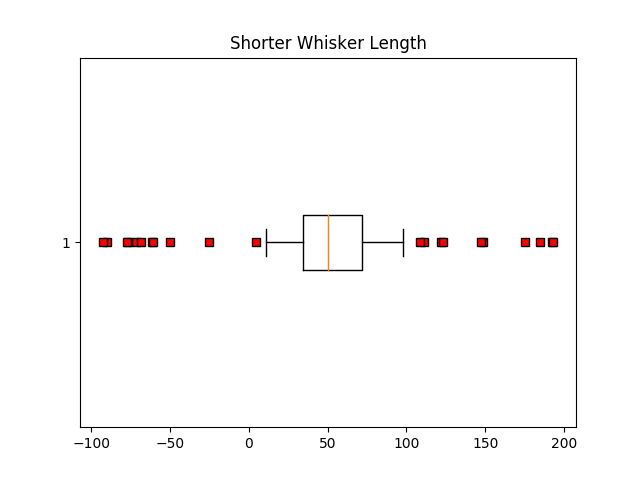
Kết quả :
{'whiskers': [<matplotlib.lines.Line2D object at 0x7fb113e304a8>, <matplotlib.lines.Line2D object at 0x7fb113e31358>], 'caps': [<matplotlib.lines.Line2D object at 0x7fb113e316a0>, <matplotlib.lines.Line2D object at 0x7fb113e319e8>], 'boxes': [<matplotlib.lines.Line2D object at 0x7fb113e305c0>], 'medians': [<matplotlib.lines.Line2D object at 0x7fb113e31d30>], 'fliers': [<matplotlib.lines.Line2D object at 0x7fb113e4b0b8>], 'means': []}Ta tiến hành tạo thêm dữ liệu giả :
spread = np.random.rand(50) * 100
center = np.ones(25) * 40
flier_high = np.random.rand(10) * 100 + 100
flier_low = np.random.rand(10) * -100
d2 = np.concatenate((spread, center, flier_high, flier_low))
data.shape = (-1, 1)
d2.shape = (-1, 1)
Tạo mảng 2-D chỉ hoạt động nếu tất cả các cột có cùng độ dài. Nếu không, hãy sử dụng một danh sách để thay thế. Điều này thực sự hiệu quả hơn vì dù sao thì boxplot cũng chuyển đổi mảng 2-D thành danh sách các vectơ bên trong.
data = [data, d2, d2[::2,0]]
fig7, ax7 = plt.subplots()
ax7.set_title('Multiple Samples with Different sizes')
ax7.boxplot(data)

plt.show()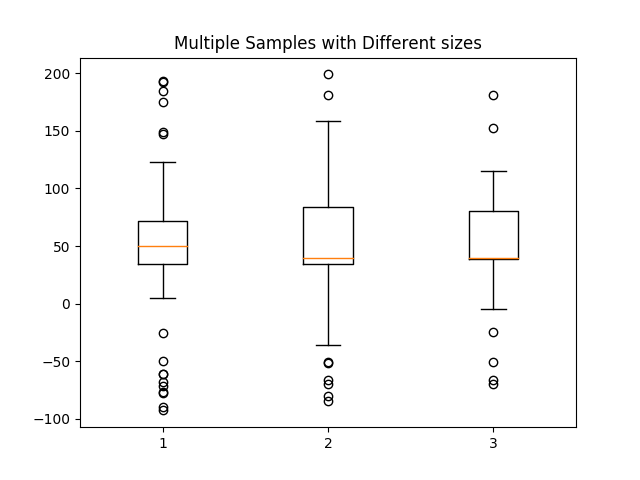
Theo dõi VnCoder trên Facebook, để cập nhật những bài viết, tin tức và khoá học mới nhất!
- Bài 1: Giới thiệu Matplotlib
- Bài 2: Môi trường cài đặt
- Bài 3: Jupyter Notebook
- Bài 4: Pyplot API
- Bài 5: Khái niệm cơ bản về Plot
- Bài 6: PyLab
- Bài 7: Giao diện hướng đối tượng
- Bài 8: Figture và Axes
- Bài 9: Multiplots
- Bài 10: Hàm Subplots() và Subplot2grid()
- Bài 11: Grids
- Bài 12: Định dạng Axes
- Bài 13: Đặt giới hạn X và Y
- Bài 14: Trục đôi
- Bài 15: Bar Plot
- Bài 16: Histogram
- Bài 17: Pie Chart ( Biểu đồ tròn )
- Bài 18: Scatter Plot ( Biểu đồ phân tán )
- Bài 19: Contour Plot ( Đồ thị đường bao )
- Bài 20: Quiver Plot
- Bài 21: Box Plot ( Biểu đồ nén)
- Bài 22: Violin Plot
- Bài 23: Three-dimensional Plotting ( Biểu đồ 3 chiều )
- Bài 24: 3D Contour Plot ( Biểu đồ viền 3D )
- Bài 25: 3D Wireframe plot
- Bài 26: 3D Surface plot
- Bài 27: Làm việc với văn bản
- Bài 28: Biểu thức toán học
- Bài 29: Làm việc với ảnh
- Bài 30: Transforms ( Biến đổi trục )