


- Bài 1: Giới thiệu Matplotlib
- Bài 2: Môi trường cài đặt
- Bài 3: Jupyter Notebook
- Bài 4: Pyplot API
- Bài 5: Khái niệm cơ bản về Plot
- Bài 6: PyLab
- Bài 7: Giao diện hướng đối tượng
- Bài 8: Figture và Axes
- Bài 9: Multiplots
- Bài 10: Hàm Subplots() và Subplot2grid()
- Bài 11: Grids
- Bài 12: Định dạng Axes
- Bài 13: Đặt giới hạn X và Y
- Bài 14: Trục đôi
- Bài 15: Bar Plot
- Bài 16: Histogram
- Bài 17: Pie Chart ( Biểu đồ tròn )
- Bài 18: Scatter Plot ( Biểu đồ phân tán )
- Bài 19: Contour Plot ( Đồ thị đường bao )
- Bài 20: Quiver Plot
- Bài 21: Box Plot ( Biểu đồ nén)
- Bài 22: Violin Plot
- Bài 23: Three-dimensional Plotting ( Biểu đồ 3 chiều )
- Bài 24: 3D Contour Plot ( Biểu đồ viền 3D )
- Bài 25: 3D Wireframe plot
- Bài 26: 3D Surface plot
- Bài 27: Làm việc với văn bản
- Bài 28: Biểu thức toán học
- Bài 29: Làm việc với ảnh
- Bài 30: Transforms ( Biến đổi trục )
Bài 20: Quiver Plot - Matplotib Cơ Bản
Đăng bởi: Admin | Lượt xem: 3061 | Chuyên mục: AI
1. Khái niệm cơ bản :
Biểu đồ quiver hiển thị các vectơ vận tốc dưới dạng mũi tên với các thành phần (u, v) tại các điểm (x, y).
quiver(x,y,u,v)Đoạn code trên vẽ các vectơ dưới dạng arrow tại các tọa độ được chỉ định trong mỗi cặp phần tử tương ứng trong x và y.
Các tham số :
Bảng sau liệt kê các thông số khác nhau cho plot Quiver:
| x | Mảng 1D hoặc 2D. Tọa độ x tại các vị trí arrow |
|---|---|
| y | Mảng 1D hoặc 2D. Tọa độ y tại các vị trí arrow |
| u | Mảng 1D hoặc 2D. Các thành phần x của vectơ arrow |
| v | |
| c |
Ví dụ :
import matplotlib.pyplot as plt
import numpy as np
x,y = np.meshgrid(np.arange(-2, 2, .2), np.arange(-2, 2, .25))
z = x*np.exp(-x**2 - y**2)
v, u = np.gradient(z, .2, .2)
fig, ax = plt.subplots()
q = ax.quiver(x,y,u,v)
plt.show()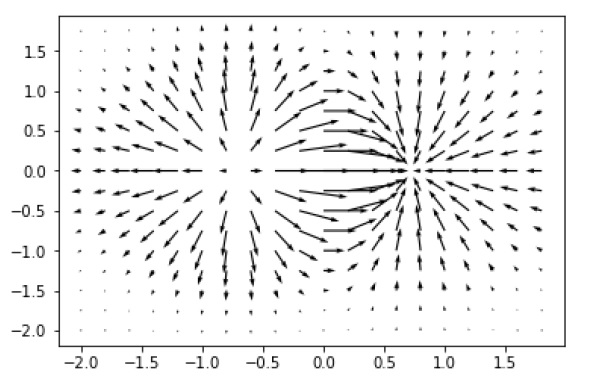
2. Các ví dụ minh hoạ :
Ví dụ 1 :
import matplotlib.pyplot as plt
import numpy as np

X = np.arange(-10, 10, 1)
Y = np.arange(-10, 10, 1)
U, V = np.meshgrid(X, Y)

fig, ax = plt.subplots()
q = ax.quiver(X, Y, U, V)
ax.quiverkey(q, X=0.3, Y=1.1, U=10,
             label='Quiver key, length = 10', labelpos='E')

plt.show()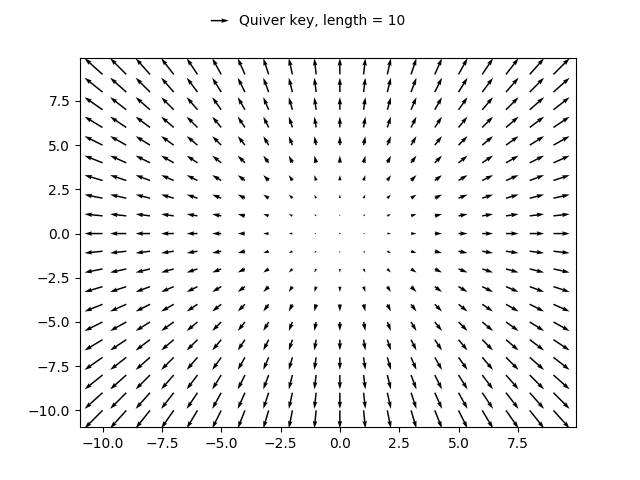
Ví dụ 2 :
import matplotlib.pyplot as plt
import numpy as np

X, Y = np.meshgrid(np.arange(0, 2 * np.pi, .2), np.arange(0, 2 * np.pi, .2))
U = np.cos(X)
V = np.sin(Y)
fig1, ax1 = plt.subplots()
ax1.set_title('Arrows scale with plot width, not view')
Q = ax1.quiver(X, Y, U, V, units='width')
qk = ax1.quiverkey(Q, 0.9, 0.9, 2, r'$2 \frac{m}{s}$', labelpos='E',
coordinates='figure')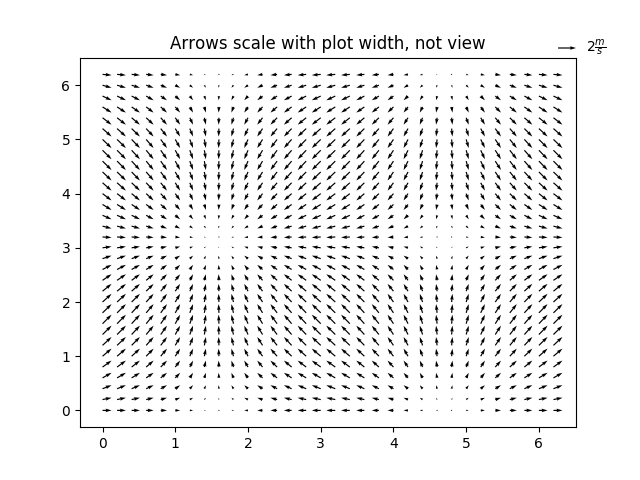
fig2, ax2 = plt.subplots()
ax2.set_title("pivot='mid'; every third arrow; units='inches'")
Q = ax2.quiver(X[::3, ::3], Y[::3, ::3], U[::3, ::3], V[::3, ::3],
               pivot='mid', units='inches')
qk = ax2.quiverkey(Q, 0.9, 0.9, 1, r'$1 \frac{m}{s}$', labelpos='E',
                   coordinates='figure')
ax2.scatter(X[::3, ::3], Y[::3, ::3], color='r', s=5)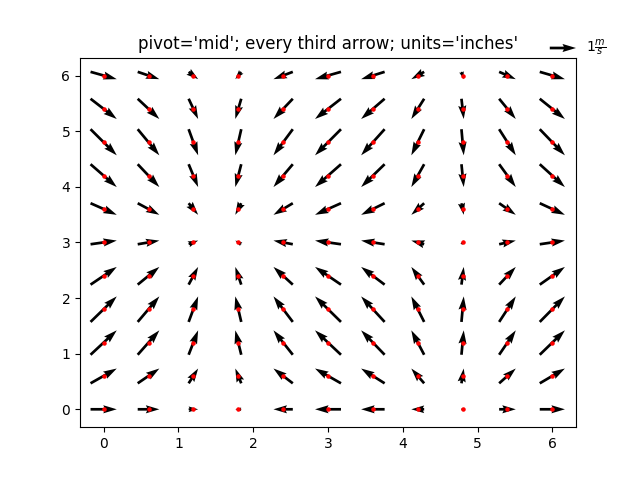
# sphinx_gallery_thumbnail_number = 3

fig3, ax3 = plt.subplots()
ax3.set_title("pivot='tip'; scales with x view")
M = np.hypot(U, V)
Q = ax3.quiver(X, Y, U, V, M, units='x', pivot='tip', width=0.022,
               scale=1 / 0.15)
qk = ax3.quiverkey(Q, 0.9, 0.9, 1, r'$1 \frac{m}{s}$', labelpos='E',
                   coordinates='figure')
ax3.scatter(X, Y, color='0.5', s=1)

plt.show()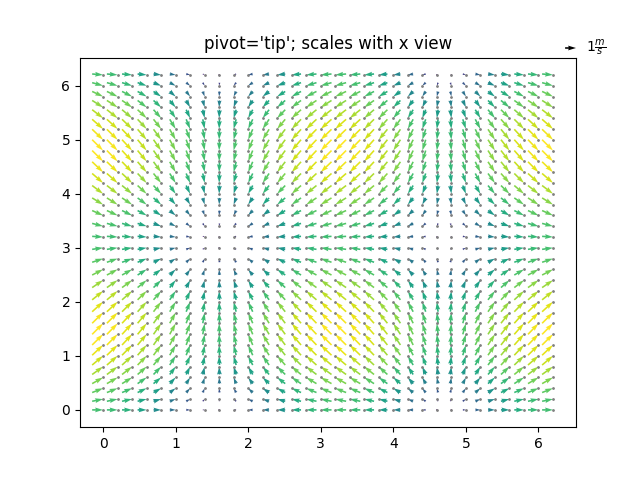
Theo dõi VnCoder trên Facebook, để cập nhật những bài viết, tin tức và khoá học mới nhất!
- Bài 1: Giới thiệu Matplotlib
- Bài 2: Môi trường cài đặt
- Bài 3: Jupyter Notebook
- Bài 4: Pyplot API
- Bài 5: Khái niệm cơ bản về Plot
- Bài 6: PyLab
- Bài 7: Giao diện hướng đối tượng
- Bài 8: Figture và Axes
- Bài 9: Multiplots
- Bài 10: Hàm Subplots() và Subplot2grid()
- Bài 11: Grids
- Bài 12: Định dạng Axes
- Bài 13: Đặt giới hạn X và Y
- Bài 14: Trục đôi
- Bài 15: Bar Plot
- Bài 16: Histogram
- Bài 17: Pie Chart ( Biểu đồ tròn )
- Bài 18: Scatter Plot ( Biểu đồ phân tán )
- Bài 19: Contour Plot ( Đồ thị đường bao )
- Bài 20: Quiver Plot
- Bài 21: Box Plot ( Biểu đồ nén)
- Bài 22: Violin Plot
- Bài 23: Three-dimensional Plotting ( Biểu đồ 3 chiều )
- Bài 24: 3D Contour Plot ( Biểu đồ viền 3D )
- Bài 25: 3D Wireframe plot
- Bài 26: 3D Surface plot
- Bài 27: Làm việc với văn bản
- Bài 28: Biểu thức toán học
- Bài 29: Làm việc với ảnh
- Bài 30: Transforms ( Biến đổi trục )