


- Bài 1: Giới thiệu Matplotlib
- Bài 2: Môi trường cài đặt
- Bài 3: Jupyter Notebook
- Bài 4: Pyplot API
- Bài 5: Khái niệm cơ bản về Plot
- Bài 6: PyLab
- Bài 7: Giao diện hướng đối tượng
- Bài 8: Figture và Axes
- Bài 9: Multiplots
- Bài 10: Hàm Subplots() và Subplot2grid()
- Bài 11: Grids
- Bài 12: Định dạng Axes
- Bài 13: Đặt giới hạn X và Y
- Bài 14: Trục đôi
- Bài 15: Bar Plot
- Bài 16: Histogram
- Bài 17: Pie Chart ( Biểu đồ tròn )
- Bài 18: Scatter Plot ( Biểu đồ phân tán )
- Bài 19: Contour Plot ( Đồ thị đường bao )
- Bài 20: Quiver Plot
- Bài 21: Box Plot ( Biểu đồ nén)
- Bài 22: Violin Plot
- Bài 23: Three-dimensional Plotting ( Biểu đồ 3 chiều )
- Bài 24: 3D Contour Plot ( Biểu đồ viền 3D )
- Bài 25: 3D Wireframe plot
- Bài 26: 3D Surface plot
- Bài 27: Làm việc với văn bản
- Bài 28: Biểu thức toán học
- Bài 29: Làm việc với ảnh
- Bài 30: Transforms ( Biến đổi trục )
Bài 22: Violin Plot - Matplotib Cơ Bản
Đăng bởi: Admin | Lượt xem: 5689 | Chuyên mục: AI
1. Khái niệm
Biểu đồ violin tương tự như biểu đồ nến, ngoại trừ việc chúng hiển thị mật độ xác suất của dữ liệu ở các giá trị khác nhau. Các biểu đồ này bao gồm một điểm đánh dấu cho trung vị của dữ liệu và một nến hiển thị phạm vi liên phần tư, như trong các plot box tiêu chuẩn. Phủ trên plot box này là ước tính mật độ nhân. Giống như box plot, plot violin được sử dụng để thể hiện sự so sánh của một phân phối thay đổi (hoặc phân phối mẫu) trên các "danh mục" khác nhau.
Một plot violin có nhiều thông tin hơn một plot box đơn thuần. Trên thực tế, trong khi biểu đồ nến chỉ hiển thị thống kê tóm tắt như phạm vi trung bình / trung vị và giữa các phần, thì biểu đồ violin hiển thị toàn bộ phân phối dữ liệu.
import matplotlib.pyplot as plt

np.random.seed(10)
collectn_1 = np.random.normal(100, 10, 200)
collectn_2 = np.random.normal(80, 30, 200)
collectn_3 = np.random.normal(90, 20, 200)
collectn_4 = np.random.normal(70, 25, 200)

## combine these different collections into a list
data_to_plot = [collectn_1, collectn_2, collectn_3, collectn_4]

# Create a figure instance
fig = plt.figure()

# Create an axes instance
ax = fig.add_axes([0,0,1,1])

# Create the boxplot
bp = ax.violinplot(data_to_plot)
plt.show()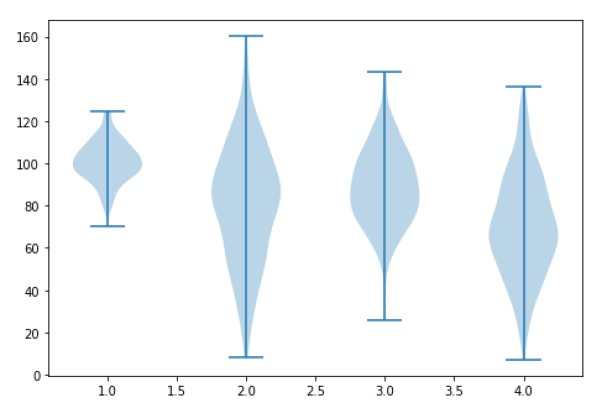
2. Ví dụ :
Ví dụ 1 : so sánh giữa biểu đồ violin và biểu đồ nến :
import matplotlib.pyplot as plt
import numpy as np

fig, axes = plt.subplots(nrows=1, ncols=2, figsize=(9, 4))

# Fixing random state for reproducibility
np.random.seed(19680801)


# generate some random test data
all_data = [np.random.normal(0, std, 100) for std in range(6, 10)]

# plot violin plot
axes[0].violinplot(all_data,
                   showmeans=False,
                   showmedians=True)
axes[0].set_title('Violin plot')

# plot box plot
axes[1].boxplot(all_data)
axes[1].set_title('Box plot')

# adding horizontal grid lines
for ax in axes:
    ax.yaxis.grid(True)
    ax.set_xticks([y + 1 for y in range(len(all_data))])
    ax.set_xlabel('Four separate samples')
    ax.set_ylabel('Observed values')

# add x-tick labels
plt.setp(axes, xticks=[y + 1 for y in range(len(all_data))],
         xticklabels=['x1', 'x2', 'x3', 'x4'])
plt.show()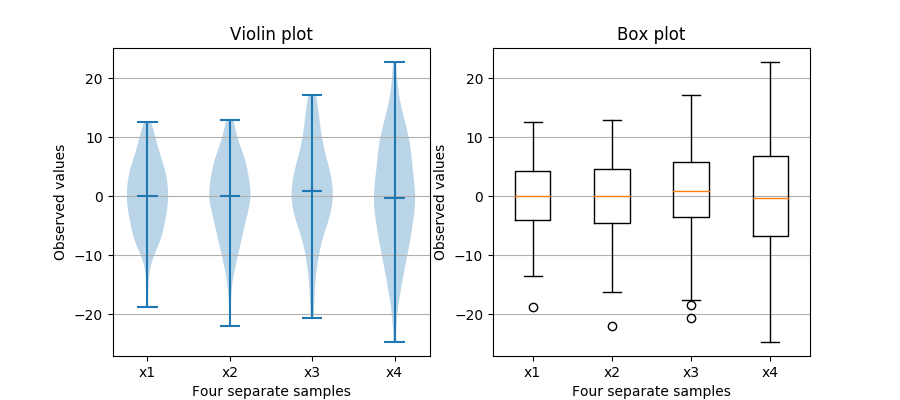
Ví dụ 2 :
import numpy as np
import matplotlib.pyplot as plt

# Fixing random state for reproducibility
np.random.seed(19680801)


# fake data
fs = 10  # fontsize
pos = [1, 2, 4, 5, 7, 8]
data = [np.random.normal(0, std, size=100) for std in pos]

fig, axes = plt.subplots(nrows=2, ncols=3, figsize=(6, 6))

axes[0, 0].violinplot(data, pos, points=20, widths=0.3,
                      showmeans=True, showextrema=True, showmedians=True)
axes[0, 0].set_title('Custom violinplot 1', fontsize=fs)

axes[0, 1].violinplot(data, pos, points=40, widths=0.5,
                      showmeans=True, showextrema=True, showmedians=True,
                      bw_method='silverman')
axes[0, 1].set_title('Custom violinplot 2', fontsize=fs)

axes[0, 2].violinplot(data, pos, points=60, widths=0.7, showmeans=True,
                      showextrema=True, showmedians=True, bw_method=0.5)
axes[0, 2].set_title('Custom violinplot 3', fontsize=fs)

axes[1, 0].violinplot(data, pos, points=80, vert=False, widths=0.7,
                      showmeans=True, showextrema=True, showmedians=True)
axes[1, 0].set_title('Custom violinplot 4', fontsize=fs)

axes[1, 1].violinplot(data, pos, points=100, vert=False, widths=0.9,
                      showmeans=True, showextrema=True, showmedians=True,
                      bw_method='silverman')
axes[1, 1].set_title('Custom violinplot 5', fontsize=fs)

axes[1, 2].violinplot(data, pos, points=200, vert=False, widths=1.1,
                      showmeans=True, showextrema=True, showmedians=True,
                      bw_method=0.5)
axes[1, 2].set_title('Custom violinplot 6', fontsize=fs)

for ax in axes.flat:
    ax.set_yticklabels([])

fig.suptitle("Violin Plotting Examples")
fig.subplots_adjust(hspace=0.4)
plt.show()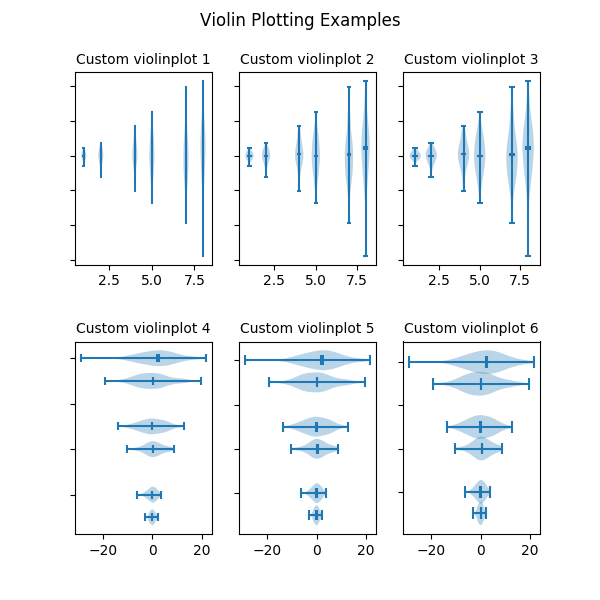
Ví dụ 3 : Điều chỉnh biểu đồ violin
Ví dụ này trình bày cách tùy chỉnh hoàn toàn các plot violin. Biểu đồ đầu tiên hiển thị kiểu mặc định bằng cách chỉ cung cấp dữ liệu. Biểu đồ thứ hai đầu tiên giới hạn những gì matplotlib vẽ với các kwargs bổ sung. Sau đó, một biểu diễn đơn giản của một biểu đồ nến được vẽ trên đầu trang
import matplotlib.pyplot as plt
import numpy as np


def adjacent_values(vals, q1, q3):
    upper_adjacent_value = q3 + (q3 - q1) * 1.5
    upper_adjacent_value = np.clip(upper_adjacent_value, q3, vals[-1])

    lower_adjacent_value = q1 - (q3 - q1) * 1.5
    lower_adjacent_value = np.clip(lower_adjacent_value, vals[0], q1)
    return lower_adjacent_value, upper_adjacent_value


def set_axis_style(ax, labels):
    ax.get_xaxis().set_tick_params(direction='out')
    ax.xaxis.set_ticks_position('bottom')
    ax.set_xticks(np.arange(1, len(labels) + 1))
    ax.set_xticklabels(labels)
    ax.set_xlim(0.25, len(labels) + 0.75)
    ax.set_xlabel('Sample name')


# create test data
np.random.seed(19680801)
data = [sorted(np.random.normal(0, std, 100)) for std in range(1, 5)]

fig, (ax1, ax2) = plt.subplots(nrows=1, ncols=2, figsize=(9, 4), sharey=True)

ax1.set_title('Default violin plot')
ax1.set_ylabel('Observed values')
ax1.violinplot(data)

ax2.set_title('Customized violin plot')
parts = ax2.violinplot(
        data, showmeans=False, showmedians=False,
        showextrema=False)

for pc in parts['bodies']:
    pc.set_facecolor('#D43F3A')
    pc.set_edgecolor('black')
    pc.set_alpha(1)

quartile1, medians, quartile3 = np.percentile(data, [25, 50, 75], axis=1)
whiskers = np.array([
    adjacent_values(sorted_array, q1, q3)
    for sorted_array, q1, q3 in zip(data, quartile1, quartile3)])
whiskersMin, whiskersMax = whiskers[:, 0], whiskers[:, 1]

inds = np.arange(1, len(medians) + 1)
ax2.scatter(inds, medians, marker='o', color='white', s=30, zorder=3)
ax2.vlines(inds, quartile1, quartile3, color='k', linestyle='-', lw=5)
ax2.vlines(inds, whiskersMin, whiskersMax, color='k', linestyle='-', lw=1)

# set style for the axes
labels = ['A', 'B', 'C', 'D']
for ax in [ax1, ax2]:
    set_axis_style(ax, labels)

plt.subplots_adjust(bottom=0.15, wspace=0.05)
plt.show()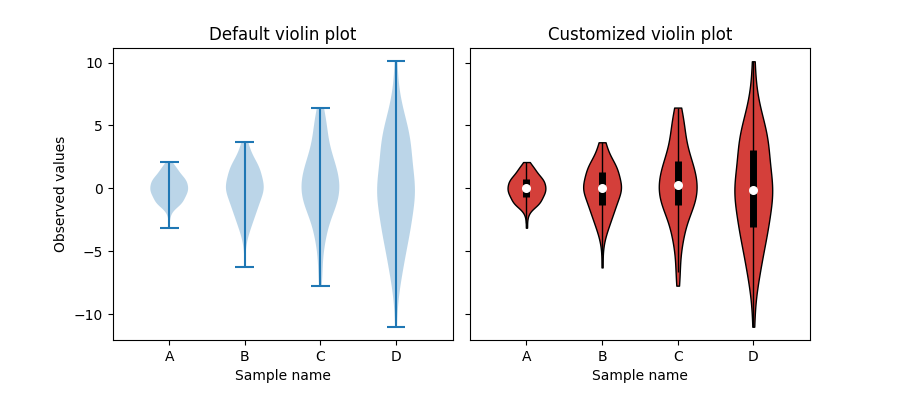
Theo dõi VnCoder trên Facebook, để cập nhật những bài viết, tin tức và khoá học mới nhất!
- Bài 1: Giới thiệu Matplotlib
- Bài 2: Môi trường cài đặt
- Bài 3: Jupyter Notebook
- Bài 4: Pyplot API
- Bài 5: Khái niệm cơ bản về Plot
- Bài 6: PyLab
- Bài 7: Giao diện hướng đối tượng
- Bài 8: Figture và Axes
- Bài 9: Multiplots
- Bài 10: Hàm Subplots() và Subplot2grid()
- Bài 11: Grids
- Bài 12: Định dạng Axes
- Bài 13: Đặt giới hạn X và Y
- Bài 14: Trục đôi
- Bài 15: Bar Plot
- Bài 16: Histogram
- Bài 17: Pie Chart ( Biểu đồ tròn )
- Bài 18: Scatter Plot ( Biểu đồ phân tán )
- Bài 19: Contour Plot ( Đồ thị đường bao )
- Bài 20: Quiver Plot
- Bài 21: Box Plot ( Biểu đồ nén)
- Bài 22: Violin Plot
- Bài 23: Three-dimensional Plotting ( Biểu đồ 3 chiều )
- Bài 24: 3D Contour Plot ( Biểu đồ viền 3D )
- Bài 25: 3D Wireframe plot
- Bài 26: 3D Surface plot
- Bài 27: Làm việc với văn bản
- Bài 28: Biểu thức toán học
- Bài 29: Làm việc với ảnh
- Bài 30: Transforms ( Biến đổi trục )